Reading a fund page here
What each part of a fund page on this site shows, in the order it appears, and where each figure comes from.
This explains how things work. It is not advice about what to buy, sell or hold.
The header
The top of the page names the fund, its plan, its option and its ISIN, with the latest NAV (net asset value) and its change on the day. Then tiles of how it has done: the Annualised return over one, three and five years, each with how far it was ahead of or behind its Benchmark and Total Return Index and the benchmark's own return; the Rank in category; its deepest fall; volatility; fund size; and Expense ratio (TER). Below them are the facts: fund house, category, plan, launch date and the span of prices on record. The riskometer, fund manager, exit load and minimum SIP are listed too, as not in the data this site loads, since no source it reads carries them.
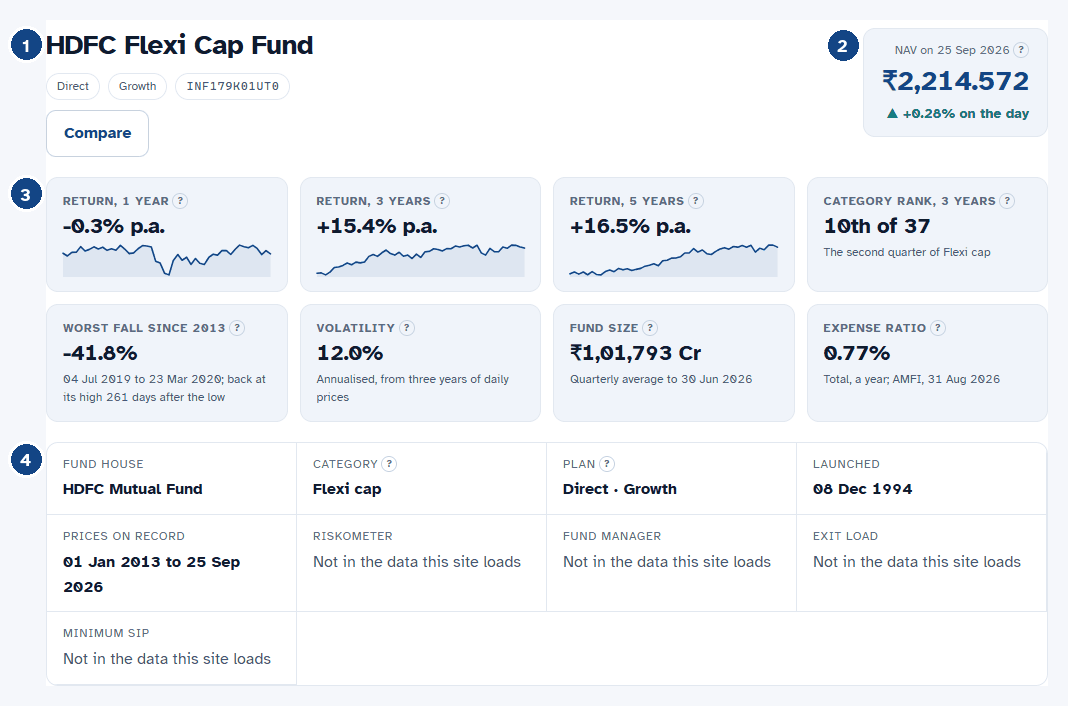
- The fund's name, its plan and option, and its ISIN.
- The latest NAV, its date and the change on the day.
- How it has done, returns first, each beside its benchmark where it has one, then its rank, falls, volatility, size and cost.
- The facts, and the ones no source this site loads carries.
Performance, growth and price
Performance sets the fund's return, volatility, deepest fall, Sharpe ratio and other measures beside its Benchmark and Total Return Index over one, three and five years. Growth shows what ₹10,000 became from the first day both the fund and its benchmark have prices, and Price shows the NAV itself over the fund's whole record. Buttons narrow the period, and a log scale keeps a long record's early years from lying flat.
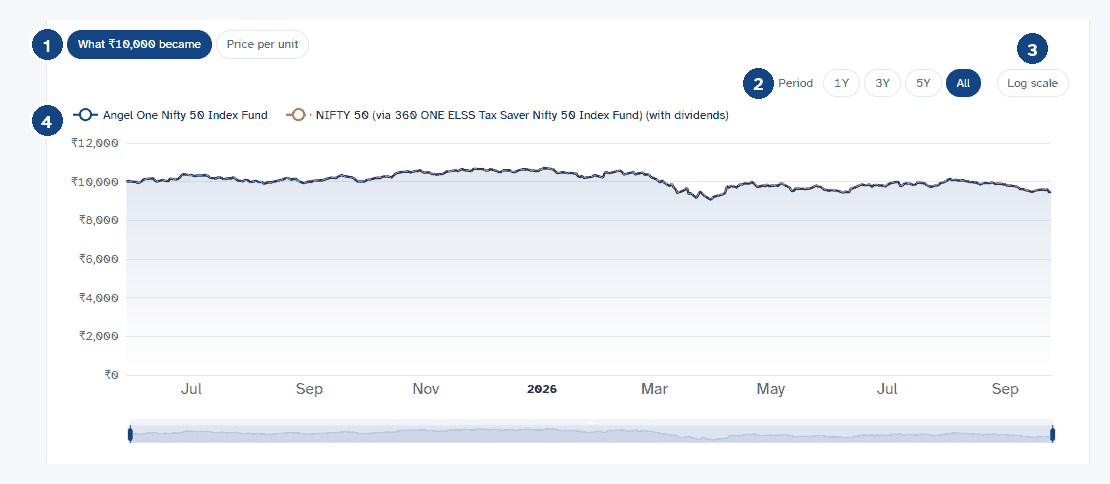
- Switch between what ₹10,000 became and the price per unit.
- Choose the period shown.
- Read it on a log scale.
- The fund and its benchmark, with dividends, from the same day.
Returns and peers
Returns sets the fund's return in each period against its benchmark's. Peers places the fund among the funds of its category on return, risk, falls and cost, with where it stands in each and its quartile.
Falls and consistency
Falls shows how far below its last high the fund stood on each day, its Deepest fall (maximum drawdown), and how long it took to recover. Consistency shows the Rolling returns of every three-year stretch, not only the one ending today.
Holdings and every figure
Holdings shows the Asset mix, the largest holdings as tiles and as a table, and the Sectors, from the fund's latest Portfolio disclosure, or from an aggregator's page where marked. The share not matched to a company is a grey bar of its own, above the tiles. Every figure lists all the computed measures for every period in one table.
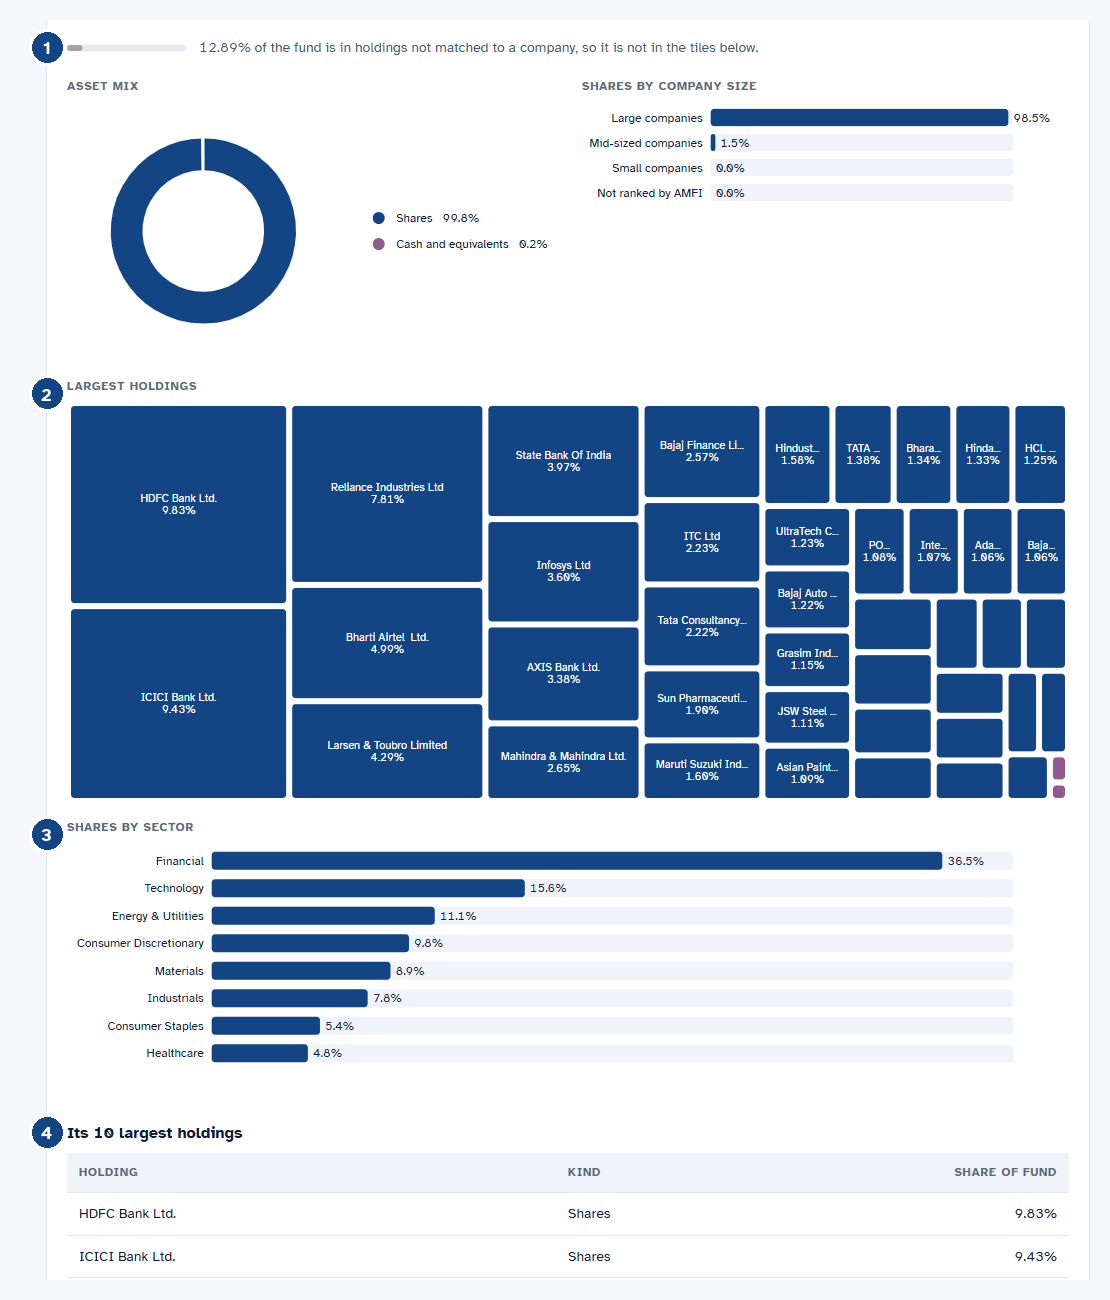
- The share not matched to a company, in grey, outside the tiles.
- The largest holdings, each tile sized by its share of the fund.
- Shares by the sector the fund house names.
- The ten largest holdings as a table; the published file has every one.
Dates, sources, confidence and gaps
Each section says how old its data is and where it came from. A figure that could not be computed shows a dash with the reason, never a zero, because a zero would be a claim. Every figure describes the past.
Each section also carries a confidence tag, graded by its weakest input. High means its data is current, complete and resolved: prices up to date and, for holdings, a fund house's own recent file with nearly every holding identified. Medium means it is usable with the notes shown beside it, such as older data, holdings read from an aggregator's page, or a share not identified. Low means its weakest input is weak, so read its notes first. The tag is never hidden, and a weak figure is shown rather than dropped.
Sources
- SEBI www.sebi.gov.in/sebi_data/faqfiles/sep-2024/1727242783639.pdf checked 02 Oct 2026
- Zerodha Varsity zerodha.com/varsity/chapter/how-to-analyse-an-equity-mutual-fund/ checked 02 Oct 2026